










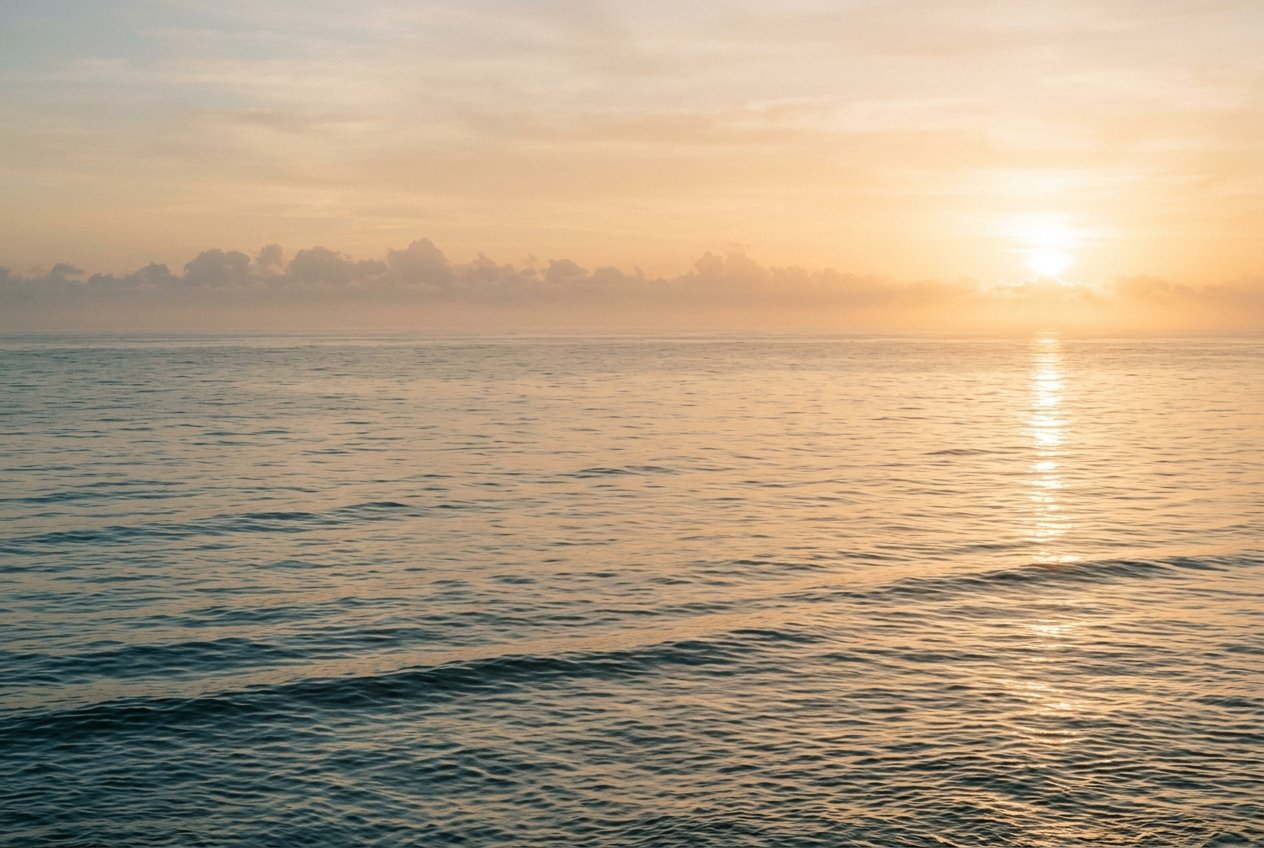
Every few years the Pacific Ocean reorganises itself. The easterly trade winds that normally pile warm surface water against Asia weaken, the warm pool drifts east, and a broad band of the equatorial Pacific runs several degrees above normal for months at a time. That is El Niño. When the warming is extreme, people call it a super El Niño.
The term sounds like a formal classification. It is not. There is no official threshold published by any meteorological body, which matters — because the gap between an ordinary El Niño and a very strong one is not merely a matter of degree. The strongest events reorganise the entire tropical atmosphere, shift rainfall on several continents simultaneously, and do so with far less lead time than milder ones.
The normal state of the Pacific
To understand what goes wrong, it helps to know how the equatorial Pacific behaves when nothing is.
Warm surface water accumulates in the western Pacific — the western Pacific warm pool, around Indonesia and northern Australia — where sea-surface temperatures can sit at 29–30 °C year round. In the eastern Pacific, off the coast of Peru and Ecuador, the water is markedly cooler, because the trade winds drag surface water westward and draw cold, nutrient-rich water up from depth to replace it. This upwelling is what makes the Peruvian fisheries so productive.
That temperature difference drives an atmospheric circulation called the Walker circulation: air rises over the warm west, flows east aloft, sinks over the cool east, and returns westward at the surface as the trade winds. The rising branch over the western Pacific is where the heavy rainfall sits — which is why Indonesia and northern Australia are wet, while coastal Peru and the eastern equatorial Pacific are arid deserts.
The whole system is a loop. Cool water keeps the winds blowing; the winds keep the water cool.
What changes during El Niño
El Niño begins when that loop loosens. The trade winds slacken, sometimes reversing briefly, and the warm pool begins sliding eastward. The consequences compound:
- The eastern Pacific warms. Weaker winds mean weaker upwelling, so the cold water that normally keeps the east cool stops reaching the surface. Sea-surface temperatures off Peru can rise by several degrees.
- The thermocline flattens. The boundary between warm surface water and cold deep water — normally tilted, shallow in the east and deep in the west — levels out. It deepens in the east, which prevents the cold water from reaching the surface even if upwelling resumes.
- Convection moves east. The atmosphere’s rising branch, and with it the rainfall, follows the warm water toward the central and eastern Pacific. Indonesia and Australia lose their wet season. Peru gains one.
- The pressure gradient reverses. Surface pressure falls in the east and rises in the west — the Southern Oscillation, the atmospheric half of the phenomenon, and the reason the full name is El Niño–Southern Oscillation, or ENSO.
Each of these changes reinforces the others. Warmer eastern water weakens the winds further, which reduces upwelling further, which warms the water further. This self-amplifying loop is the Bjerknes feedback, and it is why ENSO is treated as a coupled ocean–atmosphere phenomenon rather than a purely oceanic one. The ocean does not merely respond to the atmosphere, or vice versa — each drives the other.
How it is measured: the ONI
The standard measure is the Oceanic Niño Index (ONI), computed by NOAA’s Climate Prediction Center. It is a three-month running average of sea-surface temperature anomalies in the Niño 3.4 region — a box in the central-eastern equatorial Pacific spanning 5°N–5°S and 120°–170°W.
Two conditions together define an El Niño episode:
- The ONI reaches +0.5 °C or higher, and
- it does so for five consecutive overlapping three-month seasons — for example ONDJF, NDJF, JFMA, FMAM, MAMJ.
La Niña is defined identically with the sign reversed: −0.5 °C or lower for five consecutive overlapping seasons. Anything in between is called ENSO-neutral.
The ONI is published retrospectively, once the seasonal average is complete. Operational forecasts use dynamical models — the US ensemble, the Japanese, European and Australian systems — alongside statistical guidance. None of them is reliable beyond about a season or two.
What “super” actually means
Here is where the term gets slippery. NOAA’s Climate Prediction Center classifies event strength by ONI peak magnitude:
| Classification | ONI peak | What it means in practice |
|---|---|---|
| Weak | 0.5 – 0.9 °C | Often hard to distinguish from natural variability |
| Moderate | 1.0 – 1.4 °C | Noticeable regional effects |
| Strong | 1.5 – 1.9 °C | Broad, well-established teleconnections |
| Very strong | 2.0 °C and above | What most people mean by “super” |
“Super El Niño” is not one of these labels. It is a term from the research literature and the press, used with a threshold that varies by source. Some papers use it for anything reaching +1.5 °C, others for +2.0 °C or above, and a few apply it more loosely to any event that produces unusually strong teleconnections. The only reliable way to know what someone means is to ask which threshold they are using.
The distinction is not academic. A +1.6 °C event and a +2.4 °C event are both “strong” by one scale, but they behave differently in the atmosphere: the strongest events produce a far more coherent global circulation response, and the relationship between forcing and impact is non-linear — doubling the anomaly can more than double the disruption.
The very strong events on record
Using the +2.0 °C threshold, only a handful of episodes qualify since modern records began:
| Event | Peak ONI | What made it stand out |
|---|---|---|
| 1982–83 | ≈ 2.2 °C | Caught forecasters largely by surprise; severe global disruption |
| 1997–98 | ≈ 2.4 °C | Widely studied; major flooding, droughts and a global coral bleaching event |
| 2015–16 | ≈ 2.6 °C | Strongest in the modern satellite record; contributed to record global warmth |
| 2023–24 | ≈ 2.0 °C | First event to reach the threshold since 2015–16 |
Several other episodes — 1972–73, 1957–58, 1991–92, 2009–10 — reached the strong band without crossing +2.0 °C. They caused serious harm in their regions without being classed as very strong, which is a useful reminder that impact and index value are related but not identical: where the rain falls, how vulnerable the population is, and what a region depends on all matter as much as the number itself.
Eastern Pacific and Central Pacific events
Not all El Niño events warm in the same place, and the location matters more than the peak value.
Eastern Pacific (EP) events — also called canonical — concentrate the warming off the coast of South America. Central Pacific (CP) events, sometimes called El Niño Modoki, peak near the date line and leave the far east comparatively cool.
The distinction matters for two reasons:
- The atmospheric response follows the warming. Convection rises where the water is warmest, so an event centred near the date line and one centred off Peru teleconnect to different places.
- Very strong events are almost exclusively eastern Pacific. The extreme anomalies that push the ONI above +2.0 °C come from the collapse of coastal upwelling, which is an eastern-Pacific process.
That is one reason super events tend to be so damaging — the eastern-Pacific configuration produces the most pronounced shift in the Walker circulation, and with it the sharpest rainfall anomalies worldwide.
Why the effects travel so far
The equatorial Pacific holds an enormous amount of heat. Changing its distribution shifts where the tropical atmosphere releases that energy, and the atmosphere propagates the consequences far beyond the tropics.
The main pathways:
- A shifted Hadley circulation. The tropics redistribute heat poleward; a change in the tropical heat source alters that outflow and the position of the subtropical jet streams.
- Rossby wave trains. Anomalies in tropical heating launch large-scale waves that curve poleward and eastward through the mid-latitude westerlies, changing where storm tracks run.
- A weakened Walker circulation. The descending branch over the eastern Indian Ocean and maritime continent suppresses rainfall across a huge area from eastern Africa through Indonesia to northern Australia.
The result is a pattern that is remarkably consistent between events: wetter conditions along the west coast of the Americas, drier conditions over Australia, Indonesia, southern Africa and usually South Asia — plus a range of mid-latitude effects. The full set of regional impacts is covered separately.
What follows a super event
ENSO events typically build through the northern-hemisphere autumn, peak in December–February, and decay during the following spring. This is why El Niño is always named for the season that straddles the end of one calendar year and the start of the next.
Decay does not mean the effects stop immediately. The ocean carries an anomaly in heat content that takes months to redistribute, and the global atmosphere retains the signature of a major event into the following year. Historically, the calendar year after a super El Niño has often been the warmest on record — 1998 after 1997–98, 2016 after 2015–16, and 2024 after 2023–24 all followed that pattern.
A further complication: ENSO events are not strongly predictable the other way round. Forecast models show a spring predictability barrier — skill drops sharply when predicting across the northern-hemisphere spring, exactly when a decaying event must be evaluated and a new one assessed.
Two common misconceptions
“El Niño guarantees a drought in India”
It does not. El Niño raises the probability of a weak Indian monsoon — Indian droughts have usually coincided with El Niño years, but most El Niño years have not produced an Indian drought. The 1997–98 event was one of the strongest on record and the Indian monsoon that year was near normal, helped by a coincident positive Indian Ocean Dipole. The relationship is statistical, not deterministic. The India-specific picture is set out in how a super El Niño affects India.
“A strong event means a strong La Niña will follow”
There is no dependable rule that a big El Niño must be followed by a big La Niña. A rebound often occurs, and some of the strongest La Niña episodes did follow major El Niños — but the coupling is loose. The two phases are best understood as the two directions ENSO wanders in, not as an oscillation with a fixed amplitude or a guaranteed swing-back. The two phases are compared directly in El Niño versus La Niña.
Frequently asked questions about super El Niño
What exactly is a super El Niño?
There is no official definition. The term is used for the strongest tier of El Niño events — usually those whose Oceanic Niño Index reaches +1.5 °C or, more commonly, +2.0 °C or above. It is a descriptive term rather than a category issued by any meteorological agency.
How long does one last?
Most episodes run for roughly nine to twelve months, building through the northern autumn, peaking in December–February and decaying through the following spring. Some weaken faster, and a few events influence conditions well into the following year through residual ocean heat.
Are super El Niño events becoming more frequent?
This is an open research question rather than a settled one. The historical record contains only a handful of such events, which is far too small a sample to establish a trend against natural variability, and climate model projections disagree on how ENSO extremes will change. What is better established is that a warmer background climate raises the baseline temperature an event is added to — so the same anomaly produces higher absolute temperatures and greater heat stress.
Can it be forecast?
Partly. Dynamical forecast systems generally provide useful warning of an emerging event from about six months ahead, and confidence rises once an event is established. Predicting the eventual peak intensity is much harder, and forecasting across the northern-hemisphere spring is where skill drops off most. Forecast agencies publish seasonal updates from around the middle of the year.
Does El Niño mean the same thing as climate change?
No. El Niño is a natural mode of variability that has occurred for thousands of years and is embedded within a changing climate. The two interact — a warmer ocean can alter the background conditions an event develops in — but one is a short-term fluctuation and the other is a long-term trend. Treating them as interchangeable leads to bad conclusions in both directions.




[…] Defined by an Oceanic Niño Index of +0.5 °C or above for five consecutive overlapping seasons. The strongest tier, sometimes called a super El Niño, is explained in what makes an El Niño super. […]