









El Niño begins in one place — a stretch of the equatorial Pacific a few thousand kilometres wide — but its effects are felt on every inhabited continent. The reason is that the tropics are the engine of the global circulation: moving the point where the tropical ocean releases heat moves the storm tracks, the jet streams and the rainfall belts that the rest of the world depends on.
The pattern is consistent enough to be useful. Roughly half the time, an established El Niño produces the same regional signature — wetter conditions along the western Americas, drier conditions over Australia, Indonesia, southern Africa and usually South Asia. The exceptions are instructive rather than inconvenient, because they show what else is competing for influence.
How an ocean anomaly becomes a global signal
Three pathways carry the effect outward:
- The Walker circulation weakens or reverses. Normally air rises over the warm western Pacific and sinks over the cool east. When the warm water moves east, the rising branch follows it, and the sinking branch — which suppresses rainfall — settles over the eastern Indian Ocean and maritime continent. That single shift dries a vast area from eastern Africa to northern Australia.
- The Hadley circulation shifts. More heat is released in the central and eastern Pacific, changing the poleward transport of energy and the position of the subtropical jets.
- Rossby wave trains propagate into the mid-latitudes. Anomalous tropical heating launches large-scale waves that curve poleward and eastward through the westerlies, reorganising where storms track.
Teleconnections are therefore not mysterious — they are the atmosphere’s normal response to a heat source that has moved.
Australia, Indonesia and Papua New Guinea
This is the region with the clearest and most damaging relationship to El Niño.
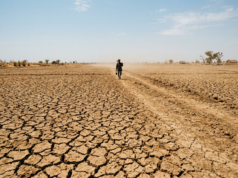
- Australia typically sees below-average rainfall across the east and north, with the effect strongest during spring and summer. Severe episodes have coincided with major drought and bushfire seasons — 1982–83, 1997–98, 2002–03 and 2015–16 all produced significant drought, with crop losses, water restrictions and elevated fire risk. Warmer-than-normal conditions compound the rainfall deficit by increasing evaporation.
- Indonesia suffers drought and, in bad years, catastrophic haze. The 1997–98 fires burned vast areas of peatland across Kalimantan and Sumatra, producing smoke that affected health across Southeast Asia for months. Drought also cuts palm oil and rubber output, which feeds through to global commodity prices.
- Papua New Guinea and the Pacific islands face water shortages, crop failure — particularly of staple taro and sweet potato — and, on low-lying atolls, reduced freshwater lens integrity.
Southeast Asia as a whole tends to be drier and warmer than normal, with elevated fire risk in peatland regions.
South and East Asia
India sees a statistically higher probability of a weak southwest monsoon, though the relationship is probabilistic rather than deterministic and depends heavily on the concurrent Indian Ocean Dipole. The consequences — agriculture, reservoirs, health and inflation — are set out in how a super El Niño affects India.
The Philippines, Vietnam and Thailand typically receive less rainfall during the developing phase, affecting rice-producing regions. China’s response is more variable: southern China tends to be drier, while parts of the Yangtze basin and the northeast can see wetter conditions, and the relationship with typhoon frequency varies by basin.
The west coast of the Americas
This is where El Niño’s effects are most direct, because the eastern Pacific is where the anomaly sits.
- Peru and Ecuador receive heavy rainfall in an otherwise arid region. The 1997–98 event brought catastrophic flooding and landslides along the coast, and 2017 produced severe flooding in Peru. Infrastructure, agriculture and fisheries are all exposed.
- Northern Chile, including the Atacama — one of the driest places on Earth — can receive unusual rainfall, causing debris flows in desert catchments that are not shaped to handle water.
- Northern Colombia and Venezuela tend to be wetter than normal.
The flip side is that the usual cold upwelling off Peru shuts down. Sea-surface temperatures rise, the thermocline deepens, and the nutrient supply that supports one of the world’s largest fisheries is cut off. Peruvian anchoveta catches collapse — the largest single-species fishery in the world — with severe consequences for fishmeal supply, coastal employment and the seabirds and marine mammals that depend on the same forage fish. Starvation events among pelagic birds have been documented during major events.
The Amazon basin
El Niño is one of the drivers of Amazon drought. Reduced rainfall and higher temperatures lower river levels — the 1997–98 and 2015–16 events both produced historically low water, stranding communities that depend on rivers, disrupting hydroelectric generation and increasing fire activity in a forest not adapted to burning. Fire in the Amazon is largely human-lit but becomes uncontrollable in El Niño drought years, and the resulting emissions feed back into the following year’s CO₂ measurements.
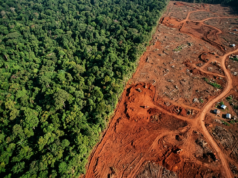
This connects to the broader land-use picture — deforestation reduces the forest’s resilience to drought, which makes each El Niño drought more damaging. That feedback is covered in causes and effects of deforestation.
North America
The mid-latitude response runs through the jet stream, and it is one of the more reliable teleconnections.
- The southern United States and northern Mexico tend to be wetter and cooler than normal during winter. Major El Niños have brought severe flooding and storm damage to California — 1982–83 and 1997–98 both produced landslides and flooding in the state.
- The Pacific Northwest and southern Canada are typically warmer and wetter than normal, with reduced snowpack in some years — which matters because snowpack, not rainfall, supplies summer water in that region.
- The northern US and Great Lakes tend to be warmer through winter.
- The Gulf and Atlantic coasts see a mix of effects, including altered tornado and severe-storm activity.
Africa
Africa’s ENSO response splits along the equator.
- East Africa — Kenya, Somalia, Ethiopia, Tanzania — typically receives enhanced short rains during October to December. In strong years this means flooding and displacement, and the relationship is one of the more dependable ENSO teleconnections. The flip side is that a failed short-rains season during a La Niña year carries serious consequences for the same communities.
- Southern Africa — South Africa, Zimbabwe, Zambia, Mozambique, Madagascar — typically sees below-normal rainfall during the January to March growing season. Major episodes have produced severe regional drought and cereal shortfalls: 1991–92, 1997–98 and 2015–16 all caused substantial crop losses across the region. For rain-fed agriculture across much of southern Africa, this is the most consequential ENSO effect there is.
Both halves illustrate the same principle: the sign of the impact depends entirely on where a region sits relative to the shifted circulation.
Hurricane seasons
El Niño has a well-established effect on Atlantic tropical cyclones, and it runs in the opposite direction to what people often assume.
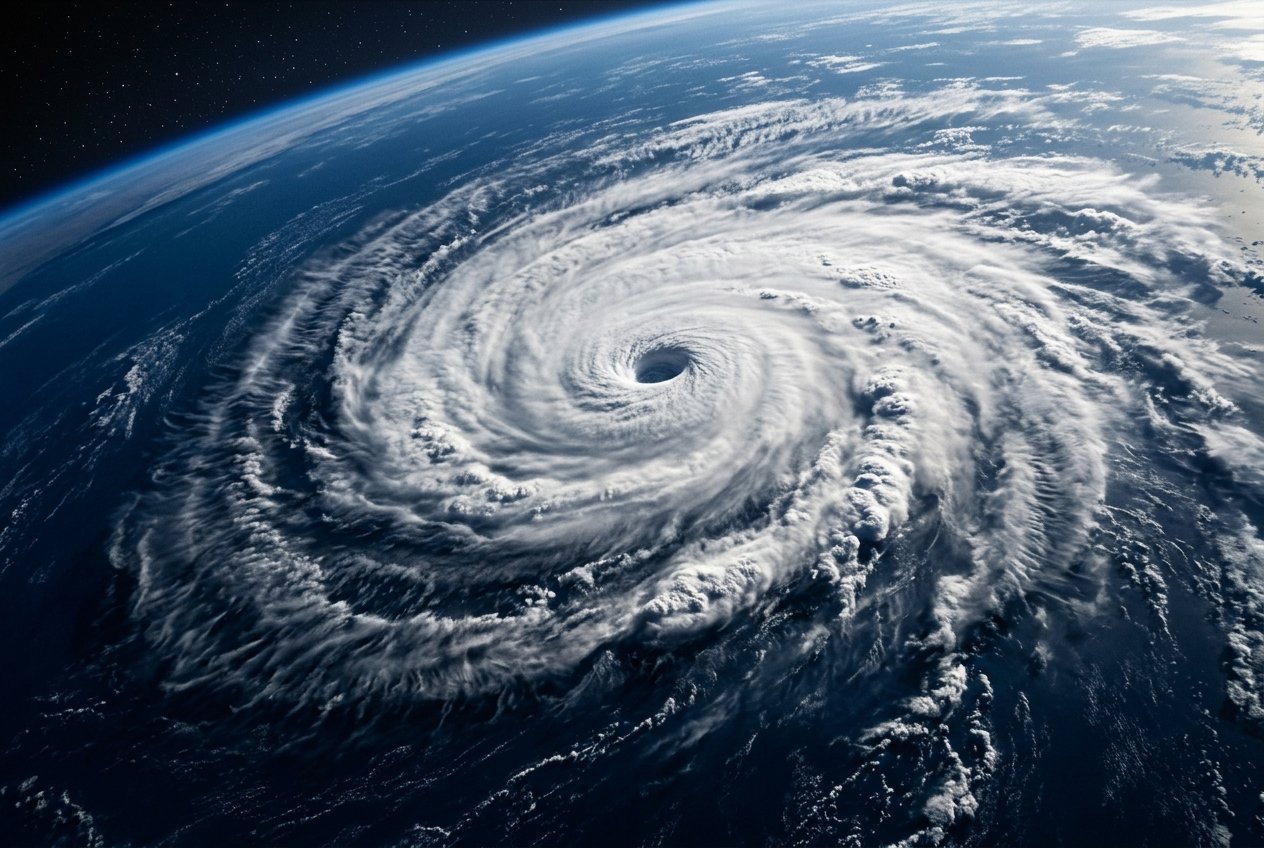
During El Niño, the upper-level westerly winds over the tropical Atlantic strengthen, increasing vertical wind shear — the difference in wind speed and direction between the surface and the upper troposphere. Shear tilts and tears apart developing tropical systems before they organise. El Niño years therefore tend to produce fewer Atlantic hurricanes, while simultaneously increasing shear across the eastern Pacific basin.
The mechanism is physical rather than statistical: shear disrupts the deep convection a tropical cyclone needs to concentrate its heat engine. The relationship is strong enough to be used in seasonal outlooks — which is why La Niña years, with reduced shear, are associated with more active Atlantic seasons.
Pacific basin effects are more complex and depend on where within the basin the warming sits.
Coral reefs and marine ecosystems
The ocean consequences extend well beyond fisheries.
- Coral bleaching. Elevated sea-surface temperatures across the tropics trigger bleaching when corals expel their symbiotic algae. The 1997–98 event drove the first documented global mass bleaching event, killing significant proportions of reef on the Indian Ocean reefs and across the Pacific. Later events have repeated the pattern. Bleaching risk is a function of how far and how long temperatures exceed the local threshold, so duration matters as much as peak anomaly.
- Reduced upwelling. Nutrient supply to surface waters falls, cutting the plankton production that underpins the food web. This is most dramatic off South America but is felt across the basin.
- Shifts in species distribution. As the thermal structure of the ocean reorganises, fish and invertebrate populations move — sometimes across management boundaries, which complicates fisheries regulation.
- Marine heatwaves. An El Niño adds to background warming, so the same anomaly applied to a warmer ocean produces higher absolute temperatures and longer periods above stress thresholds.
The relationship between ocean temperature and reef health is examined further in warming, acidic oceans and coral reefs.
Effects on the global picture
Because El Niño releases heat that has been accumulating in the western Pacific warm pool, it raises global average temperature. The pattern of record-warm calendar years following very strong events — 1998 after 1997–98, 2016 after 2015–16, 2024 after 2023–24 — reflects that transfer.
This is a temporary redistribution on top of the long-term warming trend, not a substitute for it. An El Niño year is warmer than the years immediately around it; it does not tell you whether the climate is warming overall. Confusing the two leads to errors in both directions — dismissing long-term warming because a La Niña year was cooler, or overstating it because an El Niño year set a record.
Two things that are often got wrong
“Every El Niño affects the world the same way”
The general pattern repeats, but strength, location and timing vary. An eastern-Pacific event and a central-Pacific event produce different regional responses, and the concurrent state of other modes — the Indian Ocean Dipole, the Madden–Julian Oscillation, the Pacific Decadal Oscillation — can reinforce or cancel a teleconnection in any given region. This is why forecasts are probabilistic and why individual events sometimes defy the expected pattern.
“A La Niña simply means everything is reversed”
Broadly, yes — many regions see the opposite anomaly. But not all effects mirror cleanly, some regions respond to both phases in the same way, and the amplitude of a La Niña is usually smaller than a strong El Niño. The two phases are compared directly in El Niño versus La Niña.
Frequently asked questions
Which regions are most affected?
Australia, Indonesia and the broader maritime continent; the west coast of South America; southern Africa; and South Asia. East Africa’s short rains and the southern US winter also respond reliably. The most damaging impacts tend to fall where rain-fed agriculture or freshwater supply has little buffer.
Does El Niño cause flooding or drought?
Both, in different places. It is fundamentally a redistribution of rainfall — wetter where convection moves to, drier where the descending branch settles. The same event is a flood emergency in Peru and a drought emergency in Australia simultaneously.
Are El Niño events getting stronger?
Unsettled question. The historical record contains too few very strong events to establish a trend against natural variability, and climate model projections disagree on how ENSO extremes will change. What is better established is that background warming raises the absolute temperature an event is added to, which increases heat stress and bleaching risk for the same index value.
Does El Niño affect the monsoon in India every time?
No. It raises the probability of a weak monsoon but does not determine it — the Indian Ocean Dipole can offset the signal, as it largely did in 1997–98. See El Niño effects on India for the full picture.
How long do the effects last?
The ocean-atmosphere anomaly typically peaks in December–February and decays through the following spring, but residual ocean heat and the delayed response of land surfaces mean impacts — particularly on global temperature and drought in some regions — continue into the year after the event peaks.